Find jobsHire us

From spreadsheet chaos to automated insights: A data startup's journey

August 7, 2025
Does this sound familiar? It's 2:47 AM, and you're frantically cross-referencing three different Excel files to prepare tomorrow's board meeting. As a growing business leader, you're drowning in disconnected data—financial reports from one system, operational metrics from another, and performance data scattered across multiple spreadsheets. If you're running a scaling business, you've probably lived this nightmare. Here's how to break free from data chaos and build the automated insights system your business deserves.

Why your current approach is failing you

Most growing companies hit the same wall: Their spreadsheet-based reporting systems can't keep up with their success. You started simple—maybe one Excel file with basic financials. But as you added new markets, systems, and legal entities, your reporting became a house of cards.

The warning signs include:

ProblemImpact
⏰ Manual data consolidationTaking 10+ hours monthly
❌ Error rates above 20%Unreliable financial reports
🐌 Delayed decision-makingMissed market opportunities
🔀 Multiple versions of truthConfusion and mistrust
💱 Currency conversion nightmaresErrors and unreconcilable numbers

Step 1: Audit your data ecosystem (Week 1)

Before building solutions, you need to understand what you're working with. Create a comprehensive inventory:

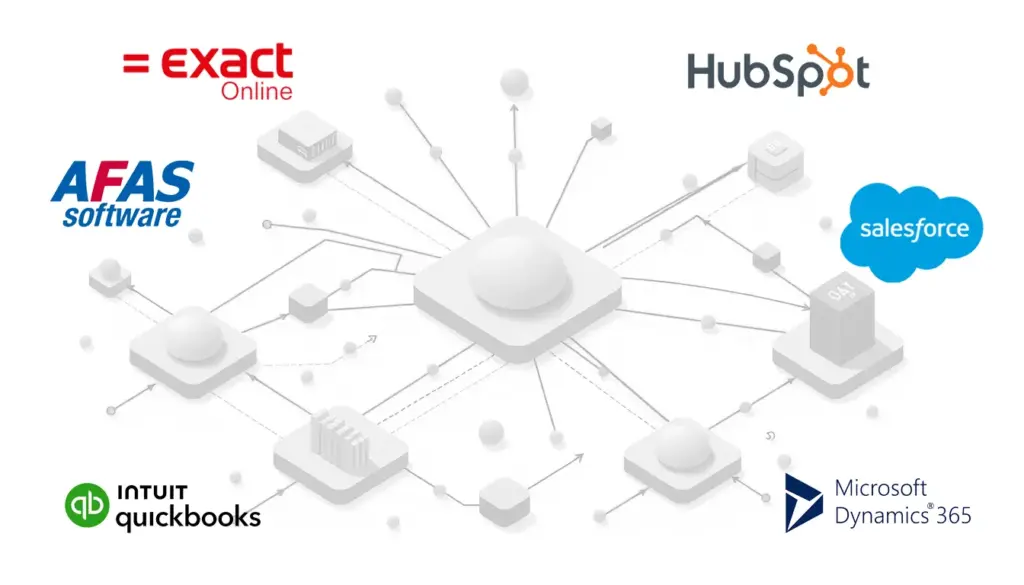
Map every data source by creating a comprehensive inventory of where your critical business information lives. Start with your financial systems like Exact Online, QuickBooks, or SAP, then expand to include CRM platforms such as Salesforce, HubSpot, or Pipedrive. Don't forget operational tools including HR systems and project management platforms, plus external data feeds like currency rates and market data that impact your reporting.

Document the pain points that are costing your business time and accuracy. Calculate exactly how many hours your team spends on manual reporting each month, identify where errors typically occur in your current process, and note which critical decisions get delayed because you're waiting for reliable data. Most importantly, list the business questions you can't answer quickly—these gaps often reveal your biggest opportunities for improvement.

Assess data quality across all your systems to understand what you're working with. Determine how current your most important data actually is, map out where the gaps and inconsistencies exist between systems, and identify which datasets need the most cleanup before they can be trusted for automated reporting. This assessment will guide your integration priorities and help you avoid building dashboards on unreliable foundations.

Step 2: Design your unified data architecture (Week 2)

The key insight: don't replace systems that work—connect them.

Choose your visualization platform: PowerBI works exceptionally well for businesses already in the Microsoft ecosystem. It integrates seamlessly with Excel workflows while providing enterprise-grade analytics capabilities.

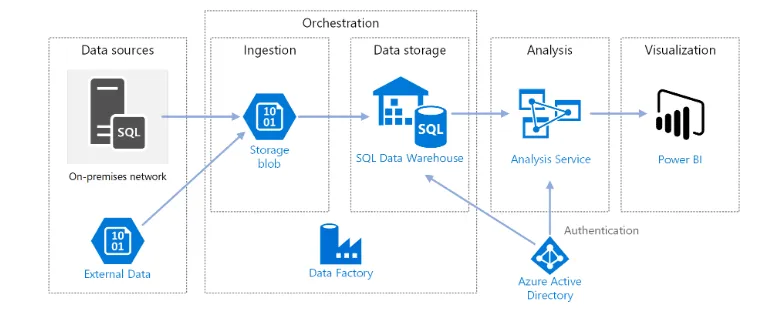
Plan your data pipeline:

  • Extract: Automated connections to source systems
  • Transform: Clean, standardize, and consolidate data
  • Load: Push processed data to your dashboard platform

Design for daily refreshes: Business moves fast. Design your pipeline to update at least once daily, preferably during off-hours to ensure fresh data each morning.

Step 3: Tackle the hardest challenge first—account mapping (Week 3-4)

For multi-entity businesses, this is where most projects get stuck. Here's how we approach it:

Create a master chart of accounts that serves as the foundation for all your consolidated reporting. This involves mapping each legal entity's GL accounts to standardized categories that make sense across your entire organization, establishing consistent naming conventions that eliminate confusion between markets, and handling currency conversions at the data level rather than in your final reports. Most critically, document all mapping rules thoroughly—future audits and system changes will thank you for this detailed documentation.

Build transformation logic that automates the complex business rules your accountants currently handle manually. Set up automated account code conversions so data from different entities flows into the right buckets, implement multi-currency consolidation that applies real-time exchange rates consistently, and configure elimination entries for inter-company transactions to avoid double-counting revenue or expenses. Always validate that your transformed totals match the source systems—this reconciliation step catches integration errors before they reach your executives.

Pro tip: This step often takes longer than expected. Budget 2-3 weeks for complex multi-entity mapping.

Step 4: Build your PowerBI dashboard foundation (Week 5-6)

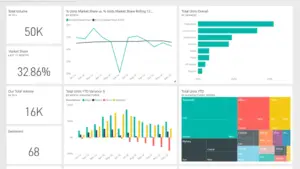
Start with the executive overview that answers these five questions instantly:

  1. How are we performing financially? (Revenue, profit, cash flow)
  2. How efficient are our operations? (Key performance indicators)
  3. Where are we growing fastest? (Geographic and segment analysis)
  4. What trends should we watch? (Leading indicators and forecasts)
  5. Where do we need attention? (Alerts and exceptions)

Design principles:

  • One-page executive summary with drill-down capabilities
  • Mobile-friendly layouts for on-the-go access
  • Interactive filters by time period, entity, currency
  • Exception highlighting for items needing immediate attention

Step 5: Implement robust data connections (Week 7-8)

Exact Online integration specifics:

  • Use REST API connections for real-time data access
  • Set up incremental data pulls to minimize load
  • Implement error handling for connection failures
  • Create data validation checkpoints

Establish refresh schedules:

  • Financial data: Daily, early morning
  • Operational metrics: Multiple times daily if needed
  • Currency rates: Real-time or hourly
  • Performance dashboards: Automatic refresh on open

Build monitoring systems:

  • Automated alerts for failed data refreshes
  • Data quality checks with exception reporting
  • Version control for dashboard changes
  • User access controls and audit trails

Step 6: Test and validate everything (Week 9)

Data accuracy verification:

  • Compare dashboard outputs to source systems
  • Validate currency conversions and consolidations
  • Test drill-down functionality across all entities
  • Confirm mobile accessibility

User acceptance testing:

  • Train key stakeholders on navigation
  • Gather feedback on layout and functionality
  • Document common questions and create FAQs
  • Establish ongoing support procedures

The results you can expect

When implemented correctly, this approach delivers measurable improvements:

Operational efficiency:

  • Monthly reporting time drops from 10+ hours to under 1 hour
  • Error rates fall below 5% (vs. 20-35% with manual processes)
  • Real-time access to critical business metrics

Strategic advantages:

  • Faster decision-making with current data
  • Hidden insights become visible (profitable segments, seasonal patterns)
  • Investor confidence through reliable, professional reporting
  • Ability to spot problems before they become crises

Technical achievements:

  • Daily automated data refreshes across all systems
  • Consolidated view across multiple legal entities
  • Successful integration with existing Exact Online workflows
  • Modern, professional dashboard interface replacing spreadsheet chaos

The technical reality you need to know

This isn't a weekend project. Here's what makes it complex:

Integration challenges:

  • Each system has different API capabilities and limitations
  • Data formats rarely match between systems
  • Currency handling requires careful calculation logic
  • Multi-entity consolidation involves complex business rules

Ongoing maintenance:

  • Source systems change, breaking connections
  • Business logic evolves, requiring updates
  • User needs expand, demanding new features
  • Data volumes grow, affecting performance

Skills required:

  • Data engineering (pipeline design and maintenance)
  • Business intelligence (dashboard design and optimization)
  • Accounting knowledge (multi-entity consolidation rules)
  • Change management (user adoption and training)

When to call for help

While the framework above gives you the roadmap, the execution requires expertise across multiple disciplines. Consider professional help if:

  • You're dealing with 3+ legal entities or complex accounting structures
  • Your timeline is critical (investor meetings, board presentations)
  • You lack internal technical resources for data engineering
  • The cost of errors in your current system is high

The difference between a successful implementation and a failed project often comes down to experience with the inevitable edge cases and integration challenges that every business faces.

Your next steps

Start with Step 1—the data audit. Spend one week documenting your current state. You'll quickly see whether this is a project you can tackle internally or if you need specialized expertise.

Most businesses discover that while the concept is straightforward, the execution requires more technical depth than initially expected. That's not a failure—it's just the reality of modern data integration.

The question isn't whether you need better data insights (you do). The question is whether you'll build this capability internally or partner with experts who've solved these challenges dozens of times before.

Either way, the cost of staying in spreadsheet chaos—missed opportunities, delayed decisions, and embarrassing errors—far exceeds the investment in proper business intelligence infrastructure.


Ready to transform your data chaos into automated insights? We've guided dozens of scaling companies through this exact transformation. The framework above gives you the roadmap, but if you want expert implementation that gets results in weeks instead of months, let's talk.

Does this sound familiar? It's 2:47 AM, and you're frantically cross-referencing three different Excel files to prepare tomorrow's board meeting. As a growing business leader, you're drowning in disconnected data—financial reports from one system, operational metrics from another, and performance data scattered across multiple spreadsheets. If you're running a scaling business, you've probably lived this nightmare. Here's how to break free from data chaos and build the automated insights system your business deserves.
Read More
AI horse race
AI is not just changing how we code—it’s starting to dictate what we code with. As large language models (LLMs) become integral to the software development lifecycle, a subtle but powerful shift is underway: languages that are more “AI-native” are accelerating faster than others. And it’s not by design—it’s by data.
Read More
Robot head looking at screen
For decades, the story of UX has been one of interfaces—more beautiful buttons, smoother animations, better onboarding flows. But something bigger is on the horizon. The next UX revolution isn’t about design tweaks. It’s about delegation. Imagine a world where you no longer need to tap, click, swipe, or scroll to get things done. Where you say, “Book me a table for two near the office,” and it just happens. That’s not fantasy—it’s the promise of agentic AI. But here’s the catch: today’s web still assumes the user is a human. And it's holding everything back.
Read More
A reusable cup solution is desperately needed—offices throw away millions of plastic cups every day. The waste adds up, while alternatives remain too inconvenient. That’s when Intelligent Reusables approached us with a bold challenge: make reuse easier than waste. The result? A seamless digital ecosystem with smart dispensers, effortless returns, and real-world impact.
Read More
In today’s fast-moving business landscape, efficiency is no longer optional—it’s critical. European business leaders are under pressure to streamline operations and boost profitability. Our recent work with a leading energy software provider shows how smart tech upgrades can unlock major efficiency gains.
Read More
Virtual power plant
Every day, governments scramble to forecast soaring electricity demand, while energy providers teeter on the brink of expensive grid upgrades. Meanwhile, homeowners and small businesses hunt for affordable, green power contracts without knowing they already hold the keys to a more stable, cost‑effective, and low‑carbon energy future.
Read More
Head office
Markkaweg 2
2153 NB Nieuw-Vennep
The Netherlands
Tech hub
Vrbanja 1 (SCC)
71000 Sarajevo
Bosnia and Herzegovina
Olympia Tech's Trends & Insights Newsletter
Become a part of our community and stay informed on the latest AI, tech and engineering insights
Subscription Form (#4)
Top cross